Blog

Data segmentation to understand your audience better

Good causes need great designs and greater details. Funders, donors, and the general public want to know more about the social value created by projects. MSC has experience in both ends of the spectrum. We worked with donors and institutions to design better products or processes and evaluate the social value created by the products or processes for end users.

Yet, one constant aspect across these products and processes is not every user uses or acts the intended way. Acquiring this understanding made us the early advocates of customer-centered design. We found segments within the population worth studying and saw an opportunity to delve into the complexities of data to identify unique segments.

The segmentation MSC uses

MSC is among the early adopters of statistical techniques to understand the study population better. We base our recommendations on insights generated from data.

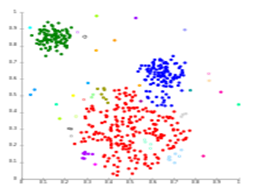
For instance, MSC conducted a study with fisherfolks to understand their financial behavior and management. The figure 1 shows three segments within the fisherfolk data, based on socio-demographic indicators, such as age, education, and income. The graph has three segments—red, green, and blue clusters—that were tested across different variables to understand their differences. Further, the graph shows groups with similar characteristics using cluster analysis.

Figure 1: Distribution of fisherfolk in three clusters

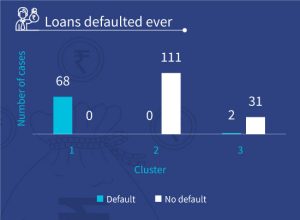
The  figures 2 and 3 depict the investment made by fisherfolk  in   past year and number of cases of default by fisherfolk in each cluster. It shows how we used the segmentation approach to understand each segment’s investment pattern, credit behavior, and rate of defaulting on loans to develop a credit assessment framework.
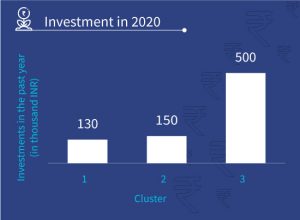
Figure 2: Investments made by fisherfolk in 2020    Figure 3: Loans ever defaulted by fisherfolk

We conducted a similar exercise with the users of small finance banks (SFB) to understand the banking needs and financial behavior of different customer segments. Segmentation allowed us to design a better and more customized range of financial products for the banks’ LMI customer segment.

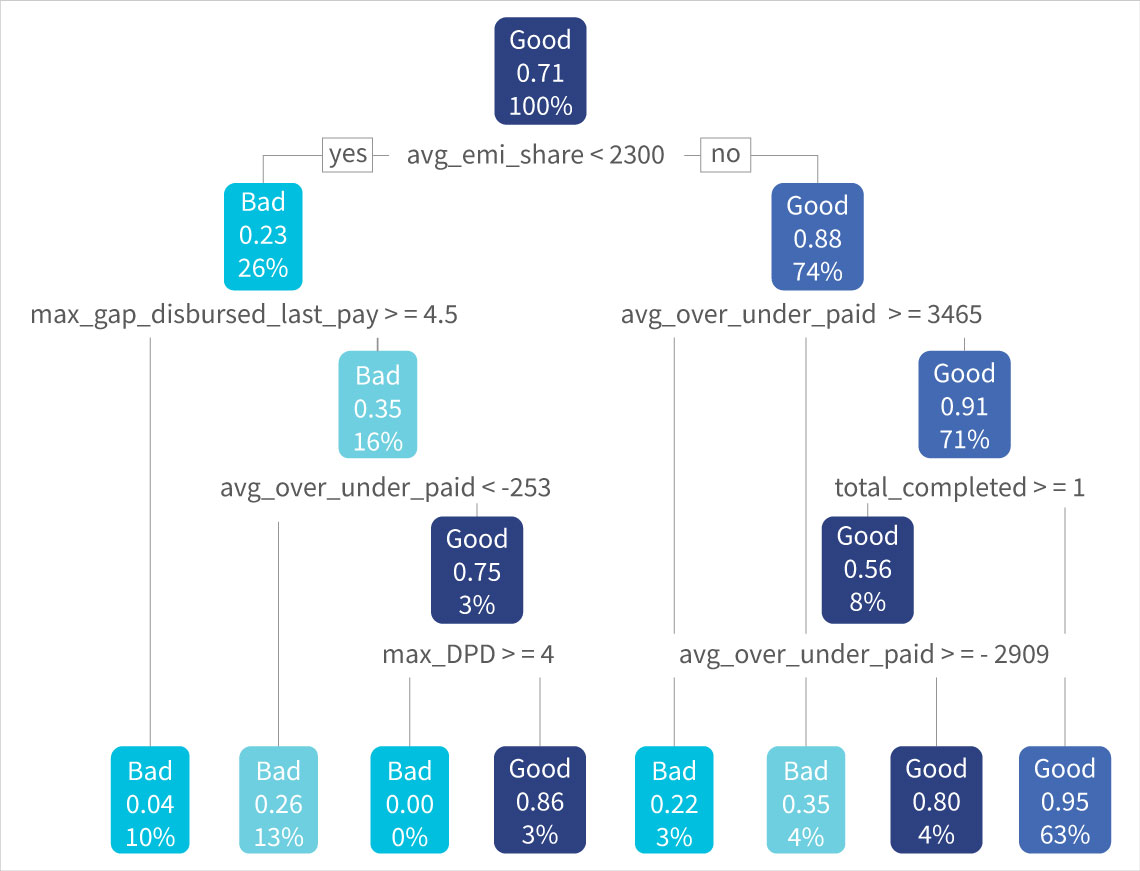
We conducted another exercise with a FinTech partner that offers digital credit to small merchants. We categorized creditworthy customers as “good” and customers with high defaults as “bad.” We followed up the segmentation exercise with predictive modeling using a decision tree approach, as shown in the figure. It helped us predict the customers’ patterns of defaulting and provide insights on indicators, such as likely geographical areas and groups of merchants with high defaults. Such analyses help businesses minimize risks greatly and adopt an agile customer approach.

Figure 4

Frontier Markets focuses on rural e-commerce. So, we conducted a similar segmentation exercise to identify their good and bad customers based on the customers’ buying preferences. Further, the segments helped us conduct anassociation analysis, make recommendations to the firm on product bundling, and provide customized marketing suggestions to its customers.

An approach to the segmentation exercise

MSC’s segmentation exercises are typically done in four steps, each adding a layer to the analysis required.

1. Variable selection phase: In the first step, we try to understand the purpose and need of the segmentation exercise. Understanding this helps chalk out the method or process to be followed to create segments from the available dataset. For instance, if we wish to know about a product’s uptake or usage, our variables of interest will be behavioral data or anything that affects that behavior, such as socio-demographics, income, or other variables.

2. Data collection and dataset development phase: Before collecting the data, we must identify customer characteristics. Once we have identified these characteristics, we can prepare a data collection plan that details where we can find each variable and the method to collect data. After data collection is over, we validate and process it, addressing outliers where needed. The data may often require creating variables from existing variables or converting numeric data to categorical data for better analysis.

3. Segmentation phase: After preparing the data for analysis, we must choose a model using machine learning techniques to conduct the segmentation exercise. The segmentation approach requires unsupervised techniques as no response variable is measured here. For example, when we predict loan defaulters the response variable is whether a person has defaulted on a loan in the past. Here, we wanted to group people with similar credit risk. Thus, no variable can be measured to compute similarity between credit behavior in a group of people.

Cluster analysis is the most popular algorithm used for segmentation. Creating rules manually to group observations together is challenging for datasets with a large number of variables. We need an algorithm to create these rules to segregate observations into homogenous groups accurately and efficiently. The cluster definitions change when we provide new data to the algorithm, which ensures that segments always reflect the current state of the data.

4. Data interpretation and modeling phase: The last step of the analysis is to find or define the characteristics of each segment obtained. We calculate averages of all data features for each cluster and use them to prepare cluster profiles to gain insights into our different segments.

However, segmentation may not help in all the scenarios. The insights generated from data can be unreliable if the sample size is not sufficiently large. Data can also lack any natural groups even though they may be present in the population. Incorrect responses, especially to ranking or Likert scale questions, can introduce bias in the data.

However, despite its limits, segmentation remains a powerful tool to find and analyze the diverse groups in a population. It enables policymakers, donors, and implementing agencies to understand and meet the needs of specific groups more effectively. In the ever-growing data economy, using tools like segmentation to understand our audience better and develop more customized and meaningful solutions.

Highlights of the webinar on “climate-resilient agriculture, virtual breakfast club”

The following are timestamps of the meeting conducted on 4th November, 2022, on “Climate resilient agriculture, virtual breakfast club.” 

We organized a discussion with a panel of experts drawn from leading agriculture startups, who focused on the following:

  1. Hurdles for AgTechs to effectively support the climate resilience of Indian smallholder farmers
  2. AgTechs that enable the identification and assessment of climate vulnerability
  3. Barriers to climate resilience of Indian smallholders that technology-enabled startups can help overcome

Click on the timestamps from the webinar stream to hear specific segments.

0:063:10 : Welcome note and Introduction by Partha Ghosh, Senior Manager at MSC’s climate change & sustainability practice, along with the presentation on the climate resilient agriculture, virtual breakfast club

3:1304:08 : Graham A.N. Wright, Founder and Group Managing Director, MSC:  Welcoming the speakers and start of the session

04:1409:15 : Introduction by the speakers

  1. Akbar Sher Khan: Cofounder, Impagro Farming Solutions 
  2. Rahul Prakash: Founder and CEO, Amalfarm
  3. Vimal Panjwani: Founder and CEO, AgriVijay

10:3111:30 : The speakers answered the first question: What are AgTechs doing to help farmers to respond to climate change?

11:4015:29 : Akbar Sher Khan of Impagro Farming Solutions responds: “Lots of innovation in identification and assessment has emerged for farmers. There are many technologies like IoT devices for soil data, micro weather stations to record data on a real-time basis, and remote sensing satellites.”

15:4721:19 : Rahul Prakash of Amalfarm responds: “We encourage farmers to adopt climate-resilient crops to cope with uncertainties in weather.”

21:4025:25 : Vimal Panjwani of Agrivijay responds: “75% of farmers are smallholder farmers. As AgTechs, we work on the ground and have many devices for weather forecast, which can help farmers with proper harvesting.”

25:3026:41 : The speakers answer the second question: How do we make AgTech services available to poor smallholder farmers?

26:4829:19 :  Vimal Panjwani of Agrivijay responds: “AgTechs face the challenge of making technology affordable and accessible for farmers.”

29:4033:49 : Rahul Prakash of Amalfarm responds: “An advisory must have localization as per the location… otherwise, it will fail to find adoption from farmers.”

34:2339:30 : Akbar Sher Khan of Impagro Farming Solutions responds: “No matter how good your tech is, it all comes down to the human side of your business.”

44:0744:54 : The speakers answer the third question: How can value chain players be involved in driving the adoption of nature-based solutions and carbon credits?

44:4648:45 : Rahul Prakash of Amalfarm responds: When a carbon farming plugin is added with the context of Indian agriculture and issues arise in the absence of farmer ownership of the land.

48:5352:57 : Akbar Sher Khan of Impagro Farming Solutions responds: “The carbon credit story to farmers is a fantasy … what we say is “the next generation will reap the benefits because your farms, your soil will survive.”

53:0456:08 : Vimal Panjwani of Agrivijay responds: “The value proposition for a farmer is increasing their income and decreasing expenses… so you have to link with that.”

56:1059:26 : Conclusion and note of thanks by Partha Ghosh, Senior Manager at MSC’s climate change & sustainability practice

59:2959:58 : Closing note by Graham A.N. Wright, Founder and Group Managing Director of MSC

Kenya plans to unlock micro, small & medium enterprises (MSME) financing

Highlights of the webinar on “Can G2P unlock women’s economic empowerment?”

  • 2:15- 10:43: Pawan Bakhshi, India Country Lead for Financial Services for the Poor program, BMGF: Welcome note and opening remarks—Can G2P unlock women’s economic empowerment?
  • 11:42- 24:09: Aparajita Singh, Manager, MSC: Introduction to MSC’s research on G2P’s potential in unlocking women’s economic empowerment—evidence from Asia and Africa
  • 25:03-26:05: Graham A.N. Wright, Founder and Group Managing Director, MSC: Context of the discussion and introduction to the panelists
  • 26:10-36:46: Sophie Sirtaine, CEO, CGAP: Response to question 1—Global evidence suggests gender norms create barriers. You wrote in a recent blog that one of CGAP’s calls to action after COVID-19 was to advance new partnerships beyond traditional financial inclusion stakeholders to address restrictive gender norms. How is CGAP developing these partnerships?
  • 37:27-44:53: Diva Dhar, Deputy Director (Data & Evidence), Women’s Economic Empowerment, BMGF: Response to question 1—What are some of the current challenges around collecting gender-disaggregated data, and what are the future pathways to close the gaps in data?
  • 45:01-51:37: Alicia Hammond, Gender and Digital Specialist, World Bank: Response to question 1—What are some of the World Bank’s priorities in terms of G2P programming globally? What is its approach to bringing government stakeholders to the table, especially when discussing the inclusion of vulnerable people?
  • 51:55-1:00:30: Wanza Mbole Namboya, Senior Economic Inclusion Advisor & Gender Lead, FSD Kenya: Response to question 1—Your work at FSD Kenya has shown much of the growth in financial inclusion in Kenya has come from women’s uptake of mobile phones. Yet the gender gap for internet use remains. What constraints deter the usage of internet services in Kenya?
  • 1:01:00-1:06:30: Sophie Sirtaine, CEO, CGAP: Response to question 2—Like most beneficiaries, women prefer to have more choices to access and withdraw G2P funds. How can G2P choice architecture circumvent, negate, or even leverage social norms to benefit them?
  • 1:07:03-1:10:40: Diva Dhar, Deputy Director (Data & Evidence), Women’s Economic Empowerment, BMGF: Response to question 2—Data collection is often a routine top-down approach that is static in terms of timelines, such as baseline, mid-line, end-line, and use—data often sits on the shelf. How can we incorporate more dynamic partnerships for data in this space?
  • 1:10:46-1:15:21: Wanza Mbole Namboya, Senior Economic Inclusion Advisor & Gender Lead, FSD Kenya: Response to question 2—Your work has shown how inclusive finance can help increase resilience among Kenyans. What lessons can governments take from Kenya on incorporating innovative financial products to deliver G2P funds?
  • 1:15:41-1:18:58: Alicia Hammond, Gender and Digital Specialist, World Bank: Response to question 2—How can we tailor G2P programs in the future to maximize their positive impact on women? Where have we made progress, and what are the remaining major challenges?
  • 1:19:30-1:30:31: Graham A.N. Wright, Founder and Group Managing Director, MSC: Q&A with the panelists and closing remarks

Can G2P unlock women’s economic empowerment? Evidence from Asia and Africa

The presentation showcases evidence from Asia and Africa on G2P’s role in enhancing women’s economic empowerment. We found that G2P programs have an overwhelmingly positive impact on households and on women’s agency in these families. Although pervasive, social norms vary across geographies and have a strong hold on G2P delivery. Besides digital and financial access, the availability and use of gender-disaggregated data and global study on social norms is the need of the hour.

DBT diagnostic study: Female beneficiaries’ experience of receiving DBT

The presentation reveals evidence from India on female beneficiaries’ experience of receiving G2P (DBT) in India. An overwhelming majority of women reported that G2P programs benefited both them and their households. Yet a few women struggled to move outside their homes independently and lacked agency over the G2P payment, which hurt their perception of G2P transfers. Meanwhile, a small percentage thought that the cost to avail of the program benefits was higher than the benefit itself.